
Every market rotation arrives with a comforting story and a messier subtext. The 2026 small-cap story is no exception. The Russell 2000 — the two-thousand-name benchmark that tracks U.S. companies below the large-cap tier — climbed roughly 21 percent through June, its best first-half performance since 1991. The iShares Russell 2000 ETF (IWM) rode the same wave, outperforming the S&P 500 by the widest margin in more than two decades. Wall Street’s explanation is tidy: after years of mega-cap concentration, capital is finally rotating downstream.
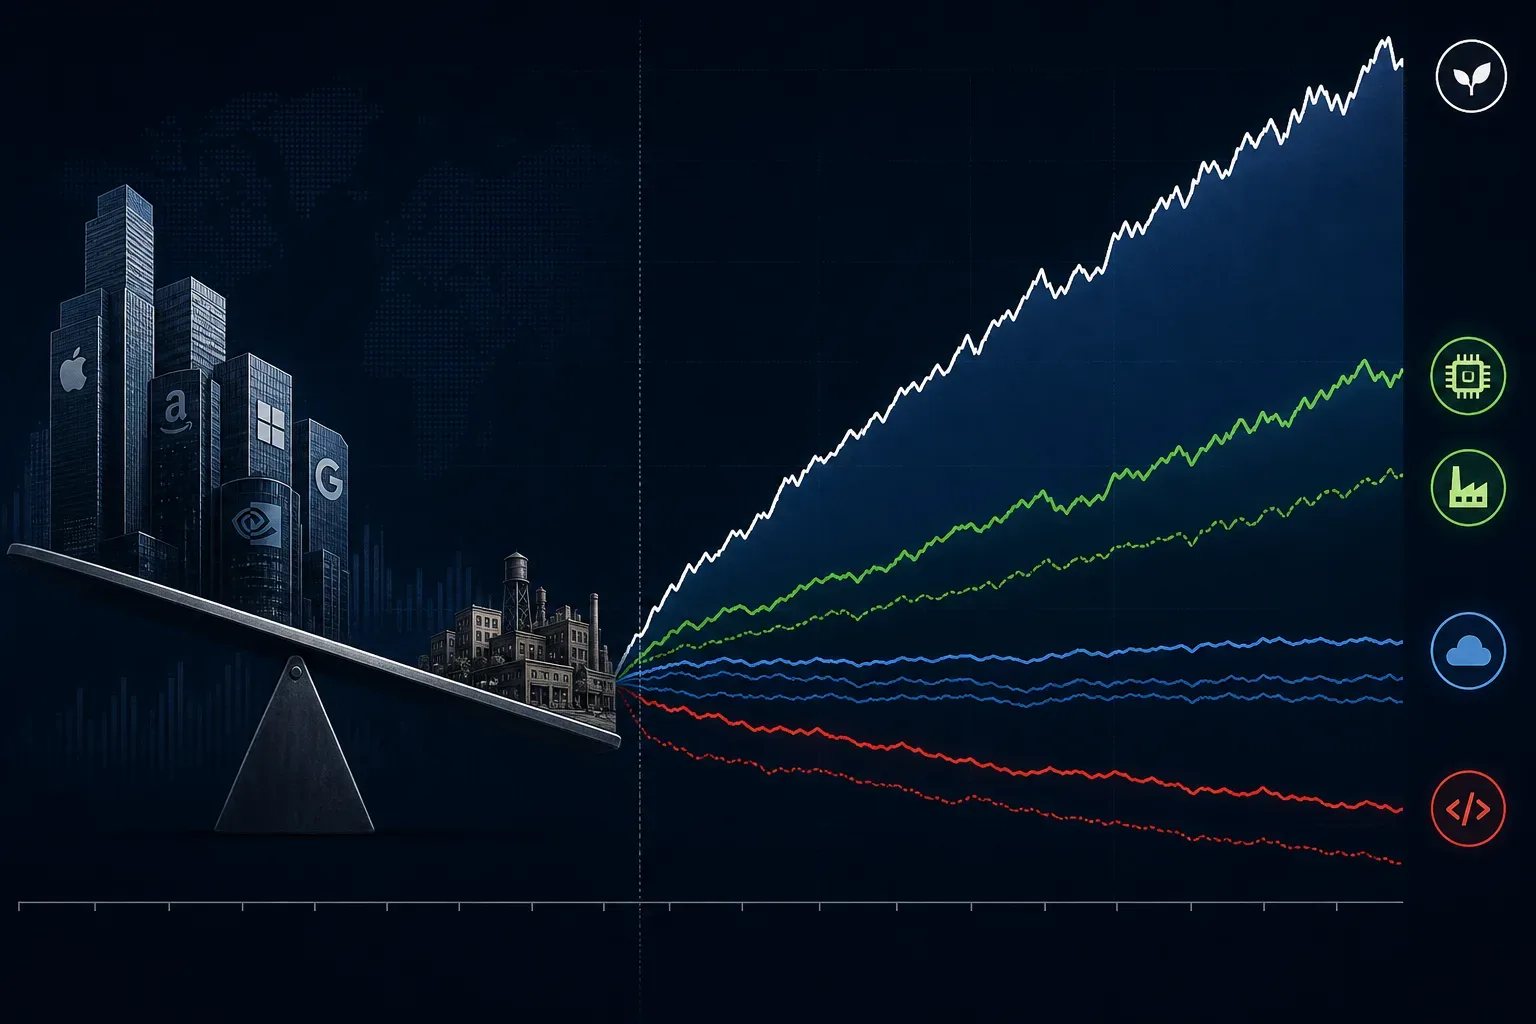
The subtext is less tidy. Hyperscalers — Amazon, Microsoft, Google, Meta — are projected to spend more than $350 billion on data-center capex in 2026, up roughly 70 percent year over year. That torrent is not lifting all boats. It is lifting the boats that sell picks and shovels to the gold rush, while sinking others that assumed the old software playbook still worked.
Capex Does Not Trickle Down — It Refracts
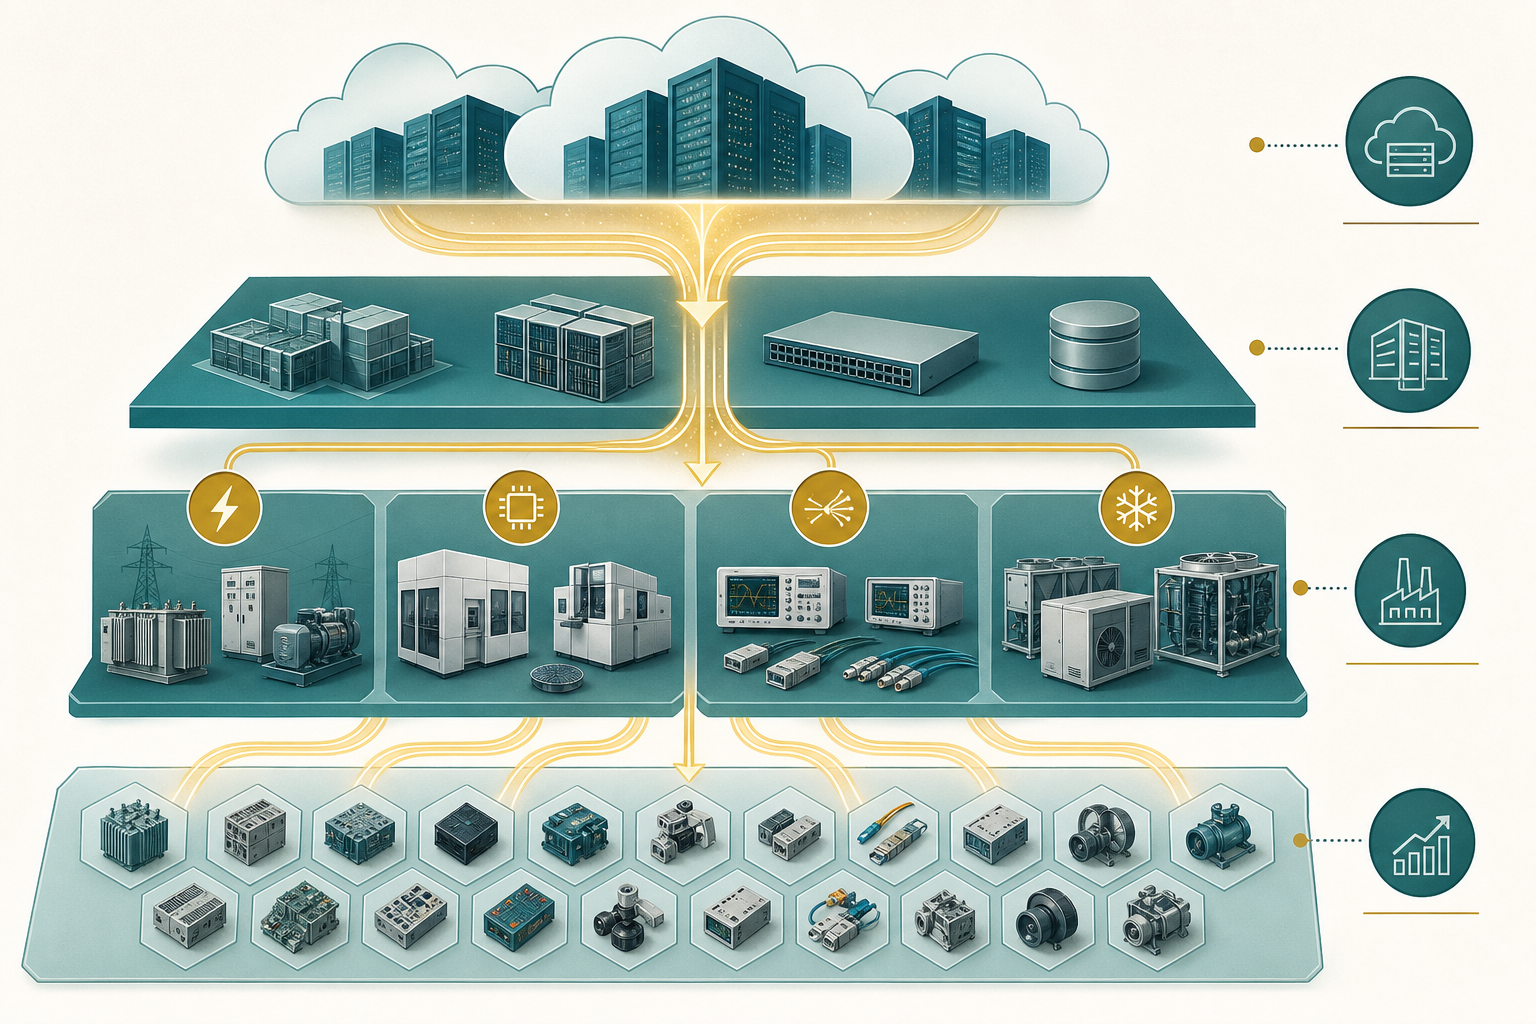
The useful mental model is not trickle-down economics. It is optics. When a concentrated beam of hyperscaler spending hits the Russell 2000, the index refracts it into distinct bands.
The first band is AI infrastructure suppliers: semiconductor test equipment, optical interconnect, power conditioning, industrial cooling, specialty chemicals. Sixteen of the Russell 2000’s top fifty performers in the first half of 2026 were chip-adjacent names. Aehr Test Systems, Ichor Holdings, and MaxLinear posted gains exceeding 400 percent. These are not AI companies in the ChatGPT sense. They are the physical layer — the companies that make sure a GPU cluster actually boots, stays cool, and passes quality control before it ships.
The second band is domestic cyclicals: regional banks, construction materials, industrial distributors, and consumer-facing businesses that benefit when the domestic economy runs warm. Consensus 2026 earnings growth for the Russell 2000 was revised from roughly 23 percent to 38 percent — a sharp upgrade driven partly by these names and partly by the infrastructure cohort.
The third band is the shadow side: small-cap software and unprofitable growth. Roughly 40 to 46 percent of Russell 2000 constituents still operate at a loss. Agentic AI — systems that can autonomously execute workflows — has repriced the terminal value of niche SaaS vendors whose moats were built on human-in-the-loop friction. The iShares Expanded Tech-Software Sector ETF fell roughly 20 percent in the same period that semiconductor equipment ETFs rose 50 percent. That divergence is not noise. It is the index telling you which small caps the AI era rewards and which it obsolesces.
The Valuation Gap Is Real — and Misleading
At roughly 18 times forward earnings, the Russell 2000 trades near a 30-year valuation discount to the S&P 500’s 26 times. That gap is the bull case in one number: small caps are cheap, and mean reversion will close the spread.
The bear case lives inside the index composition. A cheap aggregate multiple on a bifurcated index is like a sale tag on a mixed lot at auction — some items are genuinely underpriced, others are cheap for a reason. The infrastructure winners are re-rating because their order books are visible. The software losers are de-rating because their revenue models face structural interrogation. The unprofitable remainder — zombie balance sheets kept alive by zero-rate-era debt — sits in between, waiting for a refinancing event that may not arrive on favorable terms.
IWM, the most liquid Russell 2000 vehicle, holds all of these bands in market-cap weights. It is a pure expression of the index, which is both its virtue and its trap. Alternatives exist: the S&P SmallCap 600 requires profitability for inclusion, filtering out some of the loss-making tail. Vanguard’s VTWO tracks the same Russell 2000 but at lower cost. For investors who want the capex-refraction trade without the software casualty exposure, stock selection or sector tilts matter more than the ETF wrapper alone.
The Rate and Debt Ceiling Nobody Mentions on CNBC
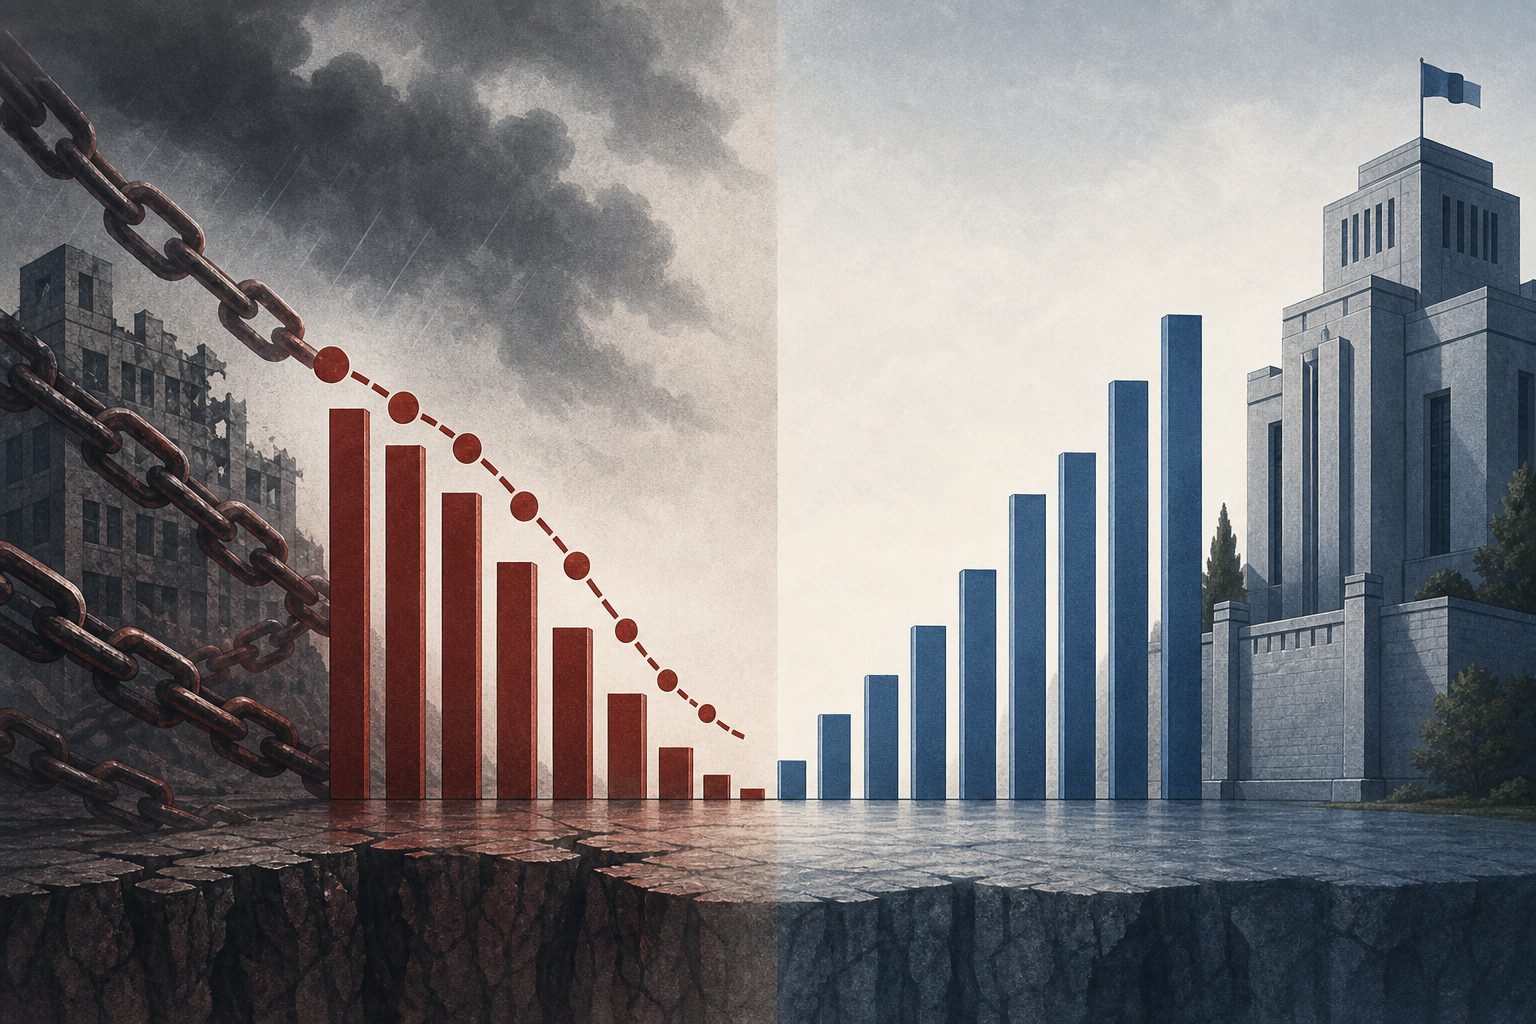
Small caps are rate-sensitive in a way large caps are not. Roughly a third to 40 percent of Russell 2000 debt floats with short-term rates. When the June nonfarm payroll report landed at 57,000 jobs — less than half the consensus — markets repriced the probability of a Fed hold above 90 percent. That is a headwind for the domestic cyclical band and a potential crisis for the debt-maturity band.
An estimated $368 billion in Russell 2000 debt matures in 2026, with another $341 billion in 2027. Companies that borrowed cheaply in 2020 and 2021 now face refinancing at meaningfully higher spreads. For profitable infrastructure suppliers with backlog visibility, that is manageable. For unprofitable software vendors whose growth narrative is under agentic-AI pressure, it is a squeeze play: refinance at higher cost into a shrinking addressable market, or cut burn and hope the cycle turns.
The K-shaped economy — strong aggregate GDP, strained household balance sheets — maps directly onto this index split. The businesses that serve hyperscaler construction sites and data-center corridors are hiring. The businesses that sell discretionary goods to median-income households are not. Small caps live closer to that domestic fault line than the S&P 500’s export-heavy multinationals.
Three Scenarios for Where Small Caps End Up
Bull case: AI capex broadening continues through 2027, earnings revisions keep climbing, and a Fed cut in late 2026 relieves the rate-sensitive cohort. The valuation discount closes. IWM delivers sustained outperformance as capital rotation becomes structural, not episodic.
Base case: The index stays bifurcated. Infrastructure small caps compound. Software small caps grind lower or get acquired at distressed multiples. The aggregate Russell 2000 outperforms modestly — not because everything recovers, but because the winners are large enough in index weight to drag the headline number up while hundreds of constituents stagnate.
Bear case: Hyperscaler capex plateaus or disappoints, the debt maturity wall triggers a wave of defaults and dilutive equity raises, and rate cuts arrive too late. The 2026 rally reverses for the cyclical and zombie cohorts. Only the most fortress-like infrastructure names hold gains.
Final Compression
The Russell 2000 is not a uniform bet on American small business. It is a lens. AI capex passes through it and separates into infrastructure winners, domestic cyclicals, and software casualties — three bands refracted from a single beam of hyperscaler spending. IWM captures all three in one ticker.
The actionable principle: treat small-cap exposure as a stock-picking problem dressed in an index costume. Know which band you are buying. The capex era does not lift all small caps. It selects.
Tags
Related Articles
Sources
FT Russell and LSEG on 2026 Russell 2000 performance; Goldman Sachs and BofA on small-cap earnings revisions; BNP Paribas on software vs semiconductor ETF divergence; Jefferies and Apollo on small-cap debt maturities; CME FedWatch and BLS on June payroll miss and rate repricing