
The slogan appeared on T-shirts at industry conferences in 2024: “DPI is the new IRR.” The mordant humor masked a structural crisis. For three consecutive years, private equity distributions as a percentage of net asset value remained below 15 percent—an industry record that reflects not caution but constraint. Limited partners are no longer interested in promises of future returns. They want their capital back, and general partners cannot deliver through traditional means.
The numbers reveal the bind. Private equity holds 32,000 unsold companies worth over $3 trillion. Median holding periods reached 6.8 years in 2025, up from 4.2 years in 2010. More than half of funds raised between 2015 and 2018 still haven’t returned investors’ initial capital. Meanwhile, dry powder—the industry’s reservoir of undeployed capital—fell from $1.3 trillion to $880 billion, not because capital was deployed but because fundraising collapsed. For the third consecutive year, fundraising declined, down 24 percent in traditional vehicles.
Engineering Liquidity Without Exits
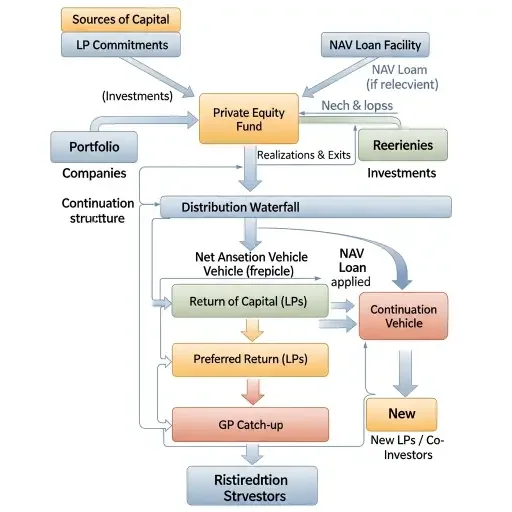
This is where the industry’s creativity—or desperation, depending on perspective—becomes visible. Unable to exit through IPOs or strategic sales at acceptable valuations, general partners engineered alternative liquidity mechanisms. NAV loans allow funds to borrow against portfolio company valuations. Continuation funds transfer aging assets into new vehicles with extended timelines. GP-led secondaries enable partial exits while retaining upside. Each mechanism creates the appearance of liquidity without requiring an actual sale.
The scale is substantial. The NAV lending market grew from an estimated $50 billion to projections of $100 billion or more annually, with some forecasts reaching $150 billion by decade’s end. The secondary market is on track for $230 billion in 2025 transaction volume, with GP-led deals representing an increasing share. Continuation vehicle contributions rose to 20 percent of distributions from mature funds, up from 6 percent in the prior five-year period.
What these figures obscure is the mechanism’s fundamental nature. NAV loans are debt facilities secured by fund assets, typically priced at 30 percent loan-to-value for private equity portfolios. They don’t create liquidity through asset realization—they manufacture it through leverage. Continuation funds don’t represent exits—they transfer assets between vehicles managed by the same GP, often at valuations set by that same GP, with existing LPs given the choice to roll into the new vehicle or receive distributions funded by… new investors or NAV loans.
The institutional Limited Partners Association flagged concerns about transparency, conflicts of interest, and the risk of overleveraging funds. When distributions to LPs are funded not by asset sales but by debt incurred at the fund level, or by capital from new investors in continuation vehicles, the character of the “return” changes materially. It’s not performance-driven capital back to investors—it’s capital recycling within an increasingly baroque architecture.
This matters because the private equity business model was predicated on time-bounded vehicles with clear exit timelines. Funds raise capital, deploy it into companies, improve operations, and exit within 5-7 years, returning multiples to investors who then reinvest in subsequent funds. The cycle’s friction was limitation on capital—good GPs could always raise more if they returned capital efficiently. The current architecture inverts this. Instead of performance determining access to future capital, financial engineering extends timelines indefinitely.
Sovereign Capital Reshapes Power Dynamics
Consider the incentive structure. Management fees on assets under management continue regardless of realization. A $2 billion fund charging 2 percent annually generates $40 million in fees whether or not assets are sold. NAV loans and continuation vehicles allow GPs to extend fee-generating periods while technically providing “liquidity” that satisfies minimum distribution requirements. The misalignment is not theoretical—it’s embedded in fund economics.
Middle Eastern sovereign wealth funds have recognized the opportunity. Saudi Arabia’s Public Investment Fund, Abu Dhabi’s ADIA and Mubadala, Qatar’s QIA, and Kuwait’s KIA collectively control over $4.9 trillion and are projected to reach $8 trillion by 2030. These entities deployed $136 billion globally in 2024, representing 54 percent of all sovereign wealth fund flows. Unlike traditional LPs facing liquidity constraints, they have sustained capital inflows from elevated energy prices and strategic mandates extending decades.
Their entry is reshaping power dynamics. Where Western pension funds and endowments operate under denominator effect pressures—private equity holdings growing as a percentage of total assets due to falling public market valuations—and demand distributions to rebalance, sovereign wealth funds can absorb long hold periods. They’re not passive limited partners; they demand co-investment rights, board seats, and strategic alignment with national development goals. Minimum ticket sizes start at $300 million, with preferred allocations between $500 million and $1 billion.
This creates bifurcation. Top-quartile GPs with established relationships, strong DPI track records, and access to sovereign capital can raise funds. Everyone else faces compression. Fundraising in 2025 concentrated among the largest, most established firms. The spread between buyout returns for the 2021 vintage year reached nearly 14 percentage points—the highest since 2014. Manager selection has become existential. Firms without distribution track records find LPs unwilling to commit to new funds, creating a doom loop where inability to exit prevents fundraising, which prevents deploying capital to generate future exits.
The Leverage Trap: Credit Stress Meets Extended Holds
The credit markets add another dimension of pressure. Sixty-one middle-market borrowers received CCC ratings in 2025—the highest on record. Nearly 30 percent of companies with maturities before year-end 2026 carried leverage above 10x or negative EBITDA. Default rates in the leveraged loan index remained modest at 1.5 percent on a headline basis, but including distressed liability management exercises, the figure reached 4.3 percent. These are portfolio companies inside private equity funds, and their stress creates refinancing risk that NAV loans and continuation vehicles cannot resolve—only postpone.
Private credit’s rise as the dominant financing source—$146 billion in dry powder at year-end 2025—ensured that portfolio companies could refinance at elevated costs, but the debt service burden compresses equity returns. Companies acquired in 2020-2021 at peak valuations now face 9-11 percent all-in borrowing costs, versus the 5 percent blended rates available at purchase. The math doesn’t work for levered returns, forcing GPs to either inject additional equity, accept lower multiples on exit, or extend hold periods further.
The Principal-Agent Misalignment
The LP community’s shift to prioritizing DPI over IRR reflects delayed recognition of this dynamic. Internal rate of return measures speed and magnitude of returns but doesn’t distinguish between realized gains and paper markups. DPI—distributions to paid-in capital—measures actual cash returned. Analysis of 2000-2015 vintage buyout funds revealed that IRR stagnates around year six or seven and declines thereafter. Holding assets longer doesn’t improve returns; it erodes them through time decay and increased operational risk.
Yet the incentive structure pushes toward longer holds. Selling at year five or six at a 2.0x multiple generates lower IRR than holding to year eight hoping for 2.5x, even if the probability of achieving that higher multiple decreases. This asymmetry—upside from extended holds accrues to GP carry while downside risk sits with LPs—creates principal-agent misalignment that NAV loans and continuation vehicles exacerbate rather than resolve.
The continuation fund mechanism illustrates this precisely. A GP transfers a portfolio company from Fund I (nearing end of life) into Fund II (a continuation vehicle). Existing LPs in Fund I can roll their position into Fund II or receive a distribution. The distribution is funded by new investors in Fund II. The GP sets the valuation at which the transfer occurs—marking their own homework—and earns management fees on both Fund I until transfer and Fund II thereafter. The LP receives “liquidity” in the form of cash from new investors, but the GP never actually sold the asset to a third party at an arm’s-length price.
If this sounds circular, that’s because it is. The private equity industry has created an internal market where assets move between vehicles without exiting to strategic buyers or public markets. As long as new capital flows into continuation vehicles—often from sovereign wealth funds or secondary specialists—the system functions. The moment that capital flow pauses, the structure reveals itself as a chain of increasingly leveraged bets on future exit windows that may or may not materialize.
ILPA’s guidance emphasized transparency, independent valuation, and LP approval mechanisms for continuation vehicles and NAV loans, but enforcement is limited. Fund documents grant GPs broad discretion, and LPs have little practical recourse beyond declining to invest in future funds—a nuclear option most avoid. The result is normalization of practices that would have been considered exceptional five years ago.
Evolution or Distortion?
The trajectory is unsustainable in its current form. Either exit markets normalize—IPO windows reopen, strategic M&A accelerates, valuations compress to levels that clear supply—or the alternative liquidity architecture becomes permanent infrastructure. The latter scenario transforms private equity from a time-bounded, return-focused asset class into something resembling permanent capital vehicles with indefinite hold periods, sustained by debt and sequential capital raises rather than value creation and realization.
Middle Eastern sovereign funds are positioned to benefit either way. If traditional exits resume, they participate in realizations at attractive entry points. If the industry shifts to permanent capital structures, they possess the patient capital and scale to become dominant players. Western LPs—pension funds, endowments, insurance companies—face different constraints. They need distributions to meet liabilities, rebalance portfolios, and deploy into new vintages. The longer capital remains trapped in unrealized positions, the more acute their denominator effect pressures become.

The 2026 outlook depends on variables largely outside private equity control. Interest rate paths determine refinancing viability for portfolio companies and buyer cost of capital for exits. Public market valuations set pricing benchmarks that private companies must meet or exceed to justify IPOs. Corporate M&A appetite depends on economic growth expectations and CEO confidence. Private credit default rates will force recognition—or forestalling—of impaired investments.
What private equity can control is the governance and transparency of its alternative liquidity mechanisms. NAV loans and continuation vehicles are legitimate tools for specific situations—extending hold periods for assets genuinely requiring more time, providing interim liquidity to LPs facing near-term needs, facilitating orderly transitions between fund vehicles. They become problematic when deployed systematically as exit substitutes, when valuations lack independent verification, when LP consent is pro forma rather than informed, when debt accumulates across fund portfolios without corresponding distribution velocity.
The industry’s resilience historically derived from its ability to adapt—LBO pioneers in the 1980s, venture-backed growth in the 1990s, operational value creation in the 2000s, global infrastructure and private credit in the 2010s. The question is whether the current adaptation represents evolution or distortion. Creating liquidity through financial engineering rather than performance-driven exits may buy time, but time is not the same as value. Eventually, companies must be sold, debt must be repaid, and returns must be realized rather than merely marked.
The firms that navigate this successfully will be those that maintain discipline—taking losses where necessary, exiting at fair valuations rather than holding for perfect ones, returning capital consistently even if absolute returns moderate, using NAV loans and continuation vehicles as supplements rather than substitutes. The firms that don’t will accumulate aging portfolios, overleveraged structures, and LP bases that refuse to reinvest.
The bifurcation is already visible in fundraising data. Top-quartile managers with strong DPI track records raised capital faster than at any point in the past decade. Median managers faced 18-24 month fundraising cycles with reduced commitments. Bottom-quartile managers couldn’t raise follow-on funds at all, leading to down-rounds, team departures, and quiet wind-downs.
DPI is the new IRR not because LPs no longer care about returns—they do—but because they’ve learned that promised future returns are worth less than cash in hand. The industry spent the 2010s convincing investors to prioritize long-term IRR over near-term distributions. The bill for that sales pitch came due in 2023-2025, when paper gains evaporated and distributions stalled while management fees continued unabated.
The sovereign wealth funds entering as major capital providers understand this history. They’re not naive. Their demands for co-investment rights, board seats, and strategic alignment reflect recognition that pure financial return is necessary but insufficient. They want operational involvement, knowledge transfer, and alignment with national development priorities. This makes them partners rather than passive investors, which changes the relationship dynamics that defined private equity for four decades.
Whether this evolution strengthens or weakens the asset class depends on execution quality over the next 24-36 months. If continuation vehicles and NAV loans facilitate value creation that genuine exits eventually validate, they’ll be remembered as innovations that bridged a difficult transition period. If they become permanent mechanisms for extending hold periods and deferring recognition of impaired investments, they’ll be remembered as the financial engineering that preceded an unwind.
The $880 billion question is which narrative proves true. The industry’s track record suggests betting on adaptation and resilience. But the structural changes underway—shift from traditional LPs to sovereign capital, substitution of debt for exits, normalization of extended hold periods—represent departures from established patterns significant enough that historical precedent may not apply. The private equity that emerges from this transition may bear little resemblance to the private equity that entered it, which is precisely what makes the current moment both precarious and defining.
Tags
Sources
Analysis drawn from McKinsey Global Private Markets Report 2026, MSCI Private Capital Transparency data, Bain & Company PE outlook, secondary market reports from Jefferies and Evercore, NAV lending market research from Callan Institute and Penn Law Review, sovereign wealth fund deployment data from Global SWF and PwC Middle East, KBRA middle market surveillance compendium, and regulatory filings from major PE firms.