
In the current moment, markets stand on a thin hinge. On one side, the Fed’s official communications churn with fragmentation—vague signals, shifting rhetoric, occasional affirmations that policy will move with data. On the other, the market price path sits near a different horizon: a near‑certainty 25 basis point cut priced in, even as inflation stubbornly dances above 2.5%. The divergence is not a mere curiosity. It is a structural affordance for convexity to reveal itself—the kind of leverage that turns small surprises into outsized moves across assets.
To understand the mechanism, start with the rule of alignment. When market-implied rate paths deviate meaningfully from the FOMC’s dot-plot median, risk economics shifts. Convexity—the sensitivity of asset prices to changes in interest rates—releases from the cage. For equities, bonds, and portfolios balanced across the risk spectrum, that release translates into a broader price range for any given data release or policy hint. In plain terms: price volatility expands precisely where you would hope it would remain anchored.
The central proposition is simple, but its implications are not. If the Fed’s communications fragment enough to keep investors guessing about the pace and timing of cuts, the market will price in those cuts with an almost reflexive certainty. The consequence is a regime where a modest policy surprise carries amplified information content. A 25bp cut, not just shaving rate levels but signaling a recalibration of the entire price mechanism, interacts with inflation that stubbornly refuses to recede to 2% uniformly. In this regime, the odds of a later rebound tightening rise, thinning the credibility of forward guidance and elevating recession risk through the back door of expectations.
This is not merely a theoretical exercise. It translates into measurable risk for portfolios. A balanced US equity-bond portfolio—equal parts price discovery and risk buffering—faces a value-at-risk expansion in the order of ~30% when the regime shift takes hold. The VaR is not a static metric; it moves with the cognitive load investors must bear as they interpret signals, reprice risk, and adjust hedges. The mechanism is intuitive once you see it: more certainty about a future policy path should reduce risk, yet fragmentation creates a paradox where certainty about a cut is not certainty about its inflationary consequences or its macroeconomic durability.
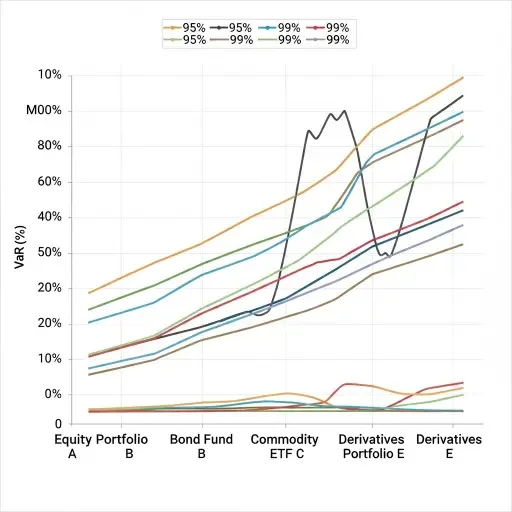
regime clarity, with a sharp uptick when the line between market path and dot-plot widens.
To translate this into a practical stance, consider three layers of response.
First, recalibrate risk budgets. If you previously assumed a stable policy path with gentle drift, treat any evidence of path divergence as a risk event. In energy terms, your VaR tolerance should shrink when convexity is in play. This does not mean panic—it means disciplined reallocation toward hedges and assets with more robust inflation sensitivity profiles, or shorter-risk horizons that can absorb unexpected policy surprises.
Second, emphasize information hygiene. Fragmented Fed communications are a cognitive tax. Build your decision structure around a few robust anchors: a clear probability lattice for policy paths, a disciplined reaction function to surprises, and a transparent reassessment cadence. The goal is not to predict the exact dot plot, but to predict how you react to its shifts.
Third, use structural hedges that address the regime’s intrinsic risks. Scenario-aware allocations—models that factor in the chance of later rebound tightening, inflation persistence, and recession-risk signals—can dampen tail risks. Equities should be weighed with a sensitivity to sectors that historically outperform under policy uncertainty, while duration and credit risk in bonds should be managed to preserve optionality for further revision of policy expectations.

From a narrative perspective, the question is not whether the Fed will cut, but how quickly and how aggressively market signals will reflect that cut given inflation’s stubbornness. The interplay between market path and central-bank messaging defines a transient regime where communication quality becomes a strategic asset. Investors should treat the dots as a guide, not a gospel—and treat regime shifts as opportunities to rebalance, recalibrate, and reframe risk.
In this sense, the architecture of a robust investment stance resembles a layered manuscript: the headline proposition (the near‑certainty cuts and their implications) is the spine; the lede and abstract map the trajectory; paragraph by paragraph, the information is distributed to avoid overload; and the final synthesis returns to a compressive memory that can be recalled even if the surrounding details fade.

”
The red thread is clear: fragmentation in policy communications creates a textured uncertainty that, when priced, expands risk via convexity. The practical antidote is a disciplined architecture of information—structured, redundant where useful, and compressed where it reinforces understanding. In a world where a modest policy move can pivot markets, the most valuable tool is not clairvoyance, but an entropy-aware approach to decision making: anticipate, quantify, and simplify without surrendering informational richness.

”
Tags
Related Articles
Sources
Synthesis of market-implied path analysis, FOMC dot plots, and risk metrics such as VaR; referenced research on convexity effects and policy surprise dynamics.