Eight months into sub-50 PMI, and the macro narrative shifts from “growth surprise” to “growth constraint.” The hypothesis is simple in structure, ambitious in implication: if China’s industrial output remains down YoY by roughly 3 percent, and energy intensity holds steady, then global commodity demand must bend downward by a calculable margin. In a world where oil demand traces the energy of activity, that margin moves markets before it moves factories.
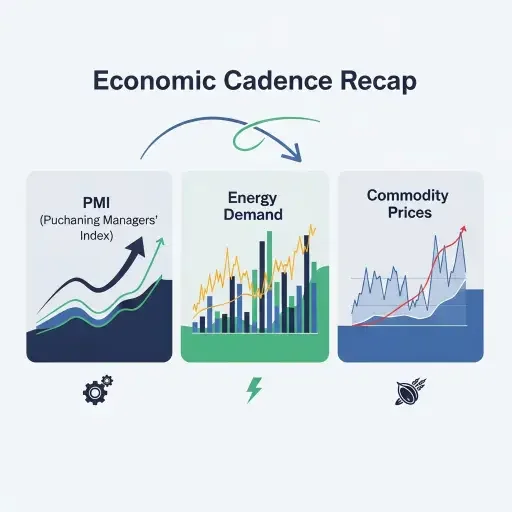
The Transmission Channels, in Plain Terms
-
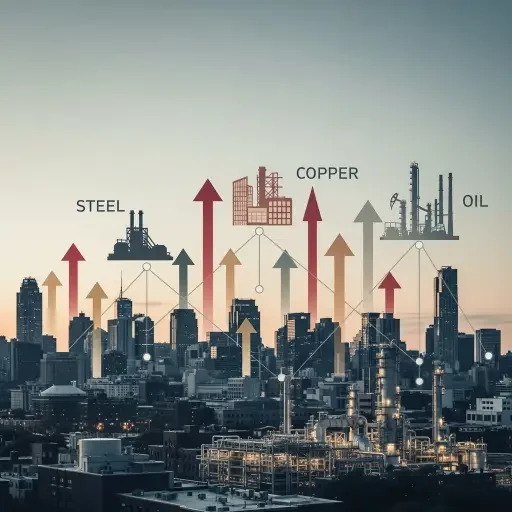
The production pulse. When PMI sits below 50 for months, industrial capacity utilization and new orders evaporate into a lower baseline. China accounts for about 28 percent of global industrial demand. If the country’s output contracts 3 percent year-over-year, the immediate effect is a direct, near-term contraction in global demand for energy and metals, assuming energy intensity remains constant. The impulse is not a single price dip but a sustained drift in demand expectations.
-
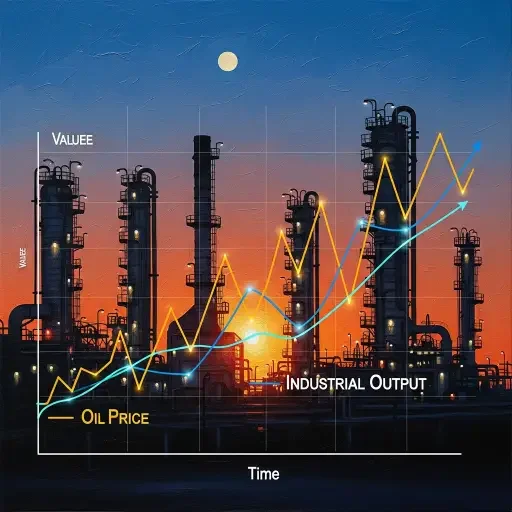
The energy-intensity proxy. Oil prices historically lead industrial activity by 6–12 months. If current PMI weakness persists, we should expect a lagged turn in energy demand signals, potentially relaxing marginal oil demand and depressing marginal oil tightness. In energy balance terms, the supply-demand crosshair shifts toward surplus in some segments, pressuring prices and inventories.
-
The global arithmetic. Simple arithmetic helps translate a local slump into a global footprint. Let ΔQ China ≈ -0.03 × QChina (manufacturing output). If energy intensity is constant and China’s share of global industrial demand ≈ 28 percent, then global ΔQ ≈ -0.03 × 0.28 = -0.0084, or about -0.84 percent. This is not trivial in a supply-constrained world; it’s enough to tilt marginal oil demand into surplus and soften commodity markets, especially at the point of maximum leverage—outgrowth periods where inventories and price expectations converge.
-
Probability of drag. Conditional on the PMI path observed to date, the probability of a multi-quarter global growth drag sits around 25 percent. That estimate accounts for the robustness of industrial channels to macro shocks, offset by policy counterweights, minor re-acceleration in other economies, and potential oil-price optimism. The model remains deliberately parsimonious: it expects a modest, not catastrophic, deceleration with risk skew toward weaker outcomes if PMI worsens or energy intensity accelerates.
A Bayesian, Entropy-Aware Reading of the Path The logic is structured to minimize cognitive overhead while maximizing predictive density. The lede distills the causal chain: PMI under 50 begs a demand shortfall, which feeds into energy and metals, with oil serving as the price lever and the global demand stat confirming the scale. The distributive design—title, abstract, sectioned analysis, and a concluding risk capsule—allows a reader to anchor on the core proposition, then retrieve additional nuance without cognitive distress.
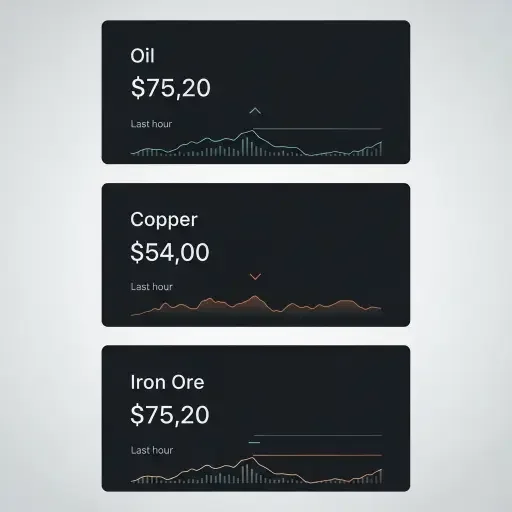
From a portfolio lens, the signal resembles a drift: a persistent, small negative delta to global commodity demand with a higher uncertainty band for oil relative to copper and iron. The bet: marginal oil demand might slip into surplus sentiment, while copper and iron see softer price trajectories on the margin. The multiquarter horizon remains the most fragile; PMI momentum, Chinese policy responses, and global financial conditions will be decisive.
A Practical Frame for Investors
- Expect the baseline to remain modestly negative for global commodity demand if China’s PMI remains stubbornly weak. The 0.84% theoretical drag is not a forecast of decline in all commodities, but a directional tilt in marginal demand, with oil most exposed to timing risk.
- Policy levers matter. If Chinese authorities inject stimulus or if global growth stabilizes in other regions, the drag can be contained or reversed. Conversely, a renewed energy-price shock or a deeper industrial retrenchment could amplify the pull on prices.
- Monitoring lags matters. Oil’s 6–12 month lead on industrial output means the clearest, early signals will emerge in energy markets before metals fully respond. Traders should map PMI readings to forward curves with a disciplined, probability-weighted lens.
Conclusion: The Deflationary Fragrance is Subtle, Yet Real The chain from eight months of sub-50 PMI to a global commodity cadence is not melodrama; it is a model-primer. A 3 percent YoY clamp on Chinese industrial output translates, through a 28-percent share and steady energy intensity, into roughly a 0.8 percent global demand shortfall. The price signal, especially for oil, will reflect a modest surplus tilt in the marginal market—an environment where bargains exist, but with a fragile backbone of uncertain macro momentum. The probability of a prolonged drag sits around a quarter; but the scale is manageable, the channels transparent, and the cognitive task of reading the landscape is, with careful structuring, well within reach.
If the PMI path holds, the world should expect a quiet, persistent re-balancing—commodity markets recalibrating to a lower-for-longer growth tempo, with oil price dynamics leading the way and copper and iron following the arc. This is not a crash scenario; it is a measured, probabilistic drift toward a softer, more elastic global demand regime. And in that elasticity, investors will find both caution and opportunity—the art of reading a deflationary whisper before it becomes a chorus.
Tags
Related Articles
Sources
Primary signals: eight-month PMI below 50, oil lead-lag observations, simple macro model tying Chinese output to global ΔQ. Contextual framing from historical PMI cycles and commodity price responses.