The Arithmetic of Conviction
Long-term holders—defined as addresses that have held Bitcoin for at least 155 days—now control 14.34 million BTC, the lowest level since May. That cutoff point, mid-July 2025, means anyone who bought then and held through Bitcoin’s run past $100,000 now qualifies as a long-term holder. They’re selling anyway.
The reduction represents a 500,000 BTC decline since July’s peak of 14.8 million. In dollar terms, at current prices near $87,000, that’s roughly $43 billion in distributed supply over five months. Previous cycles saw comparable absolute magnitudes—but compressed into weeks, not months, and concentrated at singular euphoric peaks.
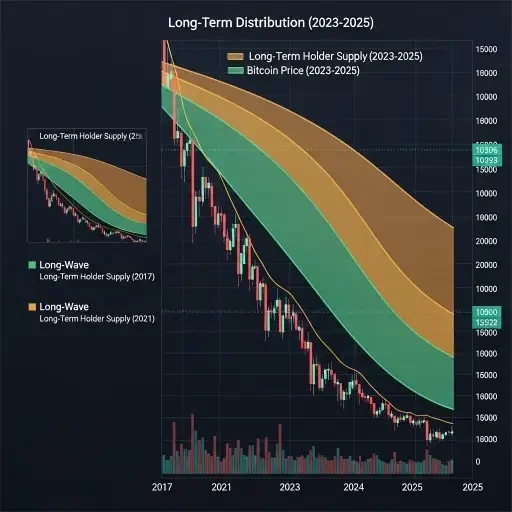
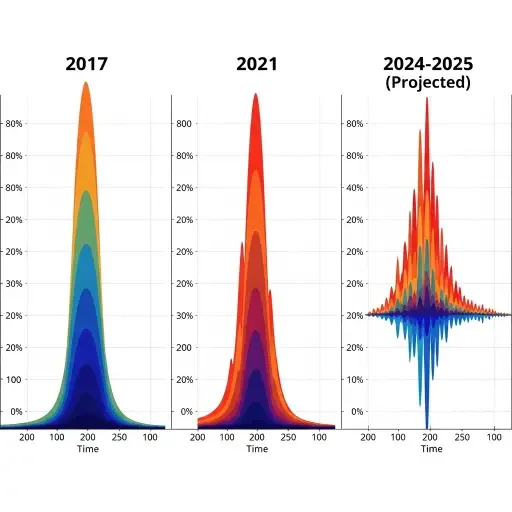
Unlike prior bull markets in 2013, 2017, and 2021, where long-term holder supply typically followed a single boom-and-bust pattern, this cycle has seen repeated waves of distribution without a clear blow-off top. The first wave arrived with spot ETF approvals in early 2024, when Bitcoin rallied from $25,000 to $73,000. The second accompanied Trump’s election victory push toward $100,000. The third is happening now, as Bitcoin trades 40% below its all-time high.
Each wave marked profit-taking into strength. None triggered the cascading liquidations that historically define cycle peaks. The market absorbed the supply, price corrected, and the pattern reset.
What Changed: The Demand Architecture
The supply side tells half the story. The demand structure explains why repeated selling hasn’t collapsed the market. In 2017 and 2021, Bitcoin’s buyer base was predominantly retail—individuals trading on exchanges, susceptible to sentiment shifts and momentum reversals. When long-term holders sold, there was no structural bid to absorb the volume. Prices spiked, attracted speculators, then crashed when those same speculators exited.
By 2025, the buyer composition had fundamentally shifted. Spot Bitcoin ETFs launched in January 2024, creating persistent institutional demand channels. MicroStrategy and other corporate treasuries accumulated systematically. Corporate treasuries held over 8% of total BTC supply as of December 2025, with MicroStrategy alone holding 650,000 BTC. These aren’t momentum traders; they’re balance sheet allocators with multi-year time horizons.
When long-term holders distribute 500,000 BTC over five months, ETFs and treasuries can absorb it incrementally without creating price dislocations. The selling becomes a feature, not a bug—a steady supply stream meeting steady institutional demand. Price volatility persists, but the violent boom-bust oscillations moderate.
This creates a paradox: long-term holder behavior in 2025 shows more measured distribution rather than blow-off-top capitulation, signaling a shift in market structure. The psychology that defined previous cycles—HODL until euphoria, then panic-sell at the peak—gives way to strategic distribution across multiple price levels. Long-term holders recognize persistent demand exists; they no longer need to time a single exit window.
The Historical Signature
In 2017, short-term trades dominated activity near the market top, with more than 70% of total Bitcoin transacting within the past three months. The HODL waves—which visualize coin age distribution—showed massive swelling in the 0-3 month bands as long-term holders dumped into retail frenzy. When that retail bid evaporated, Bitcoin fell 83% from peak to trough.
2021 repeated the pattern with slight moderation. Again, long-term holders sold heavily into the November peak. Again, short-term speculators dominated supply. The drawdown reached 78%—less severe than 2017, but still structurally similar.
The current cycle shows no such convergence. Short-term holder supply briefly touched 40% of total BTC in early 2024 but never sustained levels above 50%. Long-term holders remain the dominant cohort by supply, even as they distribute. This indicates the coins aren’t flooding into speculative short-term wallets; they’re moving to institutions and long-term accumulators who don’t immediately re-trade.
The MVRV ratio—market value divided by realized value, a proxy for aggregate profit—provides additional context. In previous cycles, long-term holder MVRV peaked at 20 in 2017 and 12 in 2021, but has only reached 3.7 in the current cycle. Long-term holders are taking profits, but at dramatically lower multiples than historically preceded peaks. Either they’re leaving significant gains on the table, or they anticipate the cycle extends further without reaching previous valuation extremes.
The Mechanics of Absorption
Large holders have sold $2.78 billion in BTC over the past 30 days as of mid-December, contributing to downward price pressure that pushed Bitcoin from $108,000 in October to current levels near $87,000. Yet the decline remains within bull-market correction parameters. The 50-week moving average, a key structural support level, sits around $85,500.
What makes this correction different from previous cycle peaks is the absence of cascading liquidations. In 2017 and 2021, when long-term holders sold en masse, the supply hit exchanges without sufficient bid depth. Prices gapped down, triggering stop-losses and margin calls, which accelerated the decline. The feedback loop turned distribution into panic.
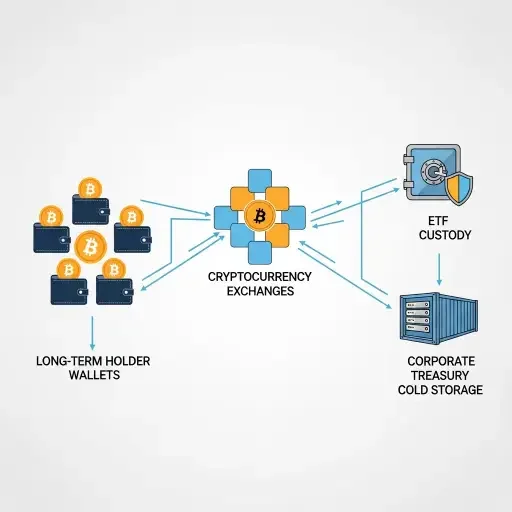
Current market microstructure shows more resilience. ETF flows, while variable, provide consistent daily demand. Onchain data shows growing transfers into custody wallets tied to ETFs and institutional products, with coins held in these wallets tending to remain dormant. This creates a one-way valve: coins flow from long-term holders into institutional custody and largely stay there, reducing circulating supply available for trading.
The three-wave pattern reflects this dynamic. Long-term holders distribute. Institutions accumulate. Price corrects but doesn’t collapse. Long-term holders wait for the next rally, then distribute again. The cycle compresses vertically—smaller price extremes—but extends horizontally—longer duration between peaks.
The Liquidity Question
Whether this pattern persists depends on institutional demand sustainability. ETF inflows have been uneven; periods of heavy accumulation alternate with outflows. MicroStrategy’s aggressive buying strategy—leveraging convertible debt to purchase Bitcoin—depends on both debt market conditions and Bitcoin price stability. If either deteriorates significantly, the absorption mechanism weakens.
Fidelity and Grayscale suggest Bitcoin’s traditional four-year cycle is losing relevance as institutional capital and sovereign adoption reshape demand patterns. The halving-driven supply shock narrative, which dominated previous cycles, matters less when annual issuance approaches zero and most coins are already in circulation. The 2024 halving reduced new supply from 900 to 450 BTC per day—a 450 BTC daily reduction. Long-term holders distributed 500,000 BTC over five months, roughly 3,300 BTC per day. The distribution far exceeds the halving’s supply tightening effect.
This inverts the traditional cycle logic. Rather than halving-induced scarcity driving price, institutional demand absorbing long-term holder distribution becomes the primary dynamic. If institutional appetite wanes—whether from regulatory shifts, macroeconomic conditions, or portfolio rebalancing—the market loses its shock absorber. Long-term holders would then face the classic dilemma: sell into declining demand and accept lower prices, or hold and risk deeper drawdowns.
The Reflexive Trap
There’s an underappreciated reflexivity in long-term holder behavior. In 2017 and 2021, most long-term holders were individuals who accumulated through earlier bear markets. Their selling decisions were largely independent—thousands of individuals reaching similar conclusions about valuations, but without coordination.
By 2025, on-chain analytics have become ubiquitous. Long-term holders monitor the same metrics they appear in. When Glassnode reports that long-term holder supply hit an 8-month low, long-term holders read it. When analysts note this differs from previous cycles, they adjust behavior accordingly. The observation influences the phenomenon.
This creates potential for meta-stability or meta-instability. If long-term holders believe institutional demand will persist, they distribute more confidently across multiple waves, expecting each selloff to be absorbed. That confidence could become self-fulfilling—distribution stays measured, institutions keep accumulating, the pattern holds. Alternatively, if long-term holders collectively decide a fourth wave won’t be absorbed as easily, they might compress their remaining distribution into a shorter timeframe, potentially overwhelming institutional bid capacity and triggering the blow-off top the cycle has so far avoided.
The data suggests the former scenario currently prevails. The market has absorbed the third sell wave remarkably well according to Checkonchain co-founder Alec, who noted that Bitcoin long-term holder spending this cycle is unlike anything seen in recent history. But market structure stability is not market structure permanence. Each wave tests the institutional bid’s depth a bit more thoroughly.
The Unasked Question
If this truly represents a structural break from historical cycles, the implications extend beyond Bitcoin. Every asset with observable on-chain behavior—Ethereum, Solana, and emerging tokens—would need to reassess cycle frameworks. The four-year pattern emerged not from Bitcoin’s code, but from the interaction of its supply schedule and market participant psychology. If participant composition changes fundamentally, the emergent pattern changes too.
Some observers suggest Bitcoin may be entering a “supercycle” that extends higher for years with only shallow corrections, while others maintain that human psychology around fear and greed remains constant regardless of participant type. The truth likely lies between: institutional demand dampens volatility but doesn’t eliminate it. Cycles persist but with altered characteristics—lower peaks relative to previous multiples, shallower troughs, longer durations.
What’s certain is that the current distribution pattern—three waves and counting, each absorbed without cascading failures—represents unprecedented territory. Long-term holders are selling. The market isn’t panicking. That divergence from script is, in itself, signal. Whether it’s signal of maturation or aberration depends on what happens when the fourth wave begins.
The Recursive Structure
Bitcoin long-term holder supply has declined for eight months, falling to levels last seen in May 2025. The reduction reflects three distinct distribution waves, each absorbed by institutional demand without triggering blow-off tops that characterized 2017 and 2021 cycles. The pattern suggests market structure has evolved: persistent institutional accumulation creates continuous absorption capacity for long-term holder selling, moderating volatility while extending cycle duration.
Think of it as a phase transition—not from solid to liquid, but from explosive to diffusive. Energy disperses across a larger surface area over longer timeframes rather than releasing in single cataclysmic events. Long-term holders still distribute. The market still corrects. But the mechanism has changed, and with it, the signature pattern that traders have relied on for a decade.
The next few months will clarify whether this represents permanent structural change or temporary aberration. For now, the cycle that won’t break continues distributing in waves, each one absorbed, each one rewriting the assumptions that defined every cycle before it.
Tags
Related Articles
Sources
Glassnode on-chain metrics, CoinDesk market analysis, Checkonchain research, historical cycle data from 2017 and 2021