
Bitcoin stands at a crossroads as 2025 closes. After reaching an all-time high near $126,000 in October 2025, the asset has pulled back sharply—trading around $86,000 on December 1st, down roughly $40,000 from peak. November saw record ETF outflows of $3.43 billion, and the Fed’s December 1st decision to halt quantitative tightening adds a new macro variable to the mix. The question now becomes forward-looking: as we enter 2026, will this correction deepen into a full bear regime with tests of $30,000? Will price stabilize around $50,000? Or could a recovery arrive with velocity that makes the recent drawdown look like a brief interruption?
This is not a fairy-tale narrative of resilience; it is a map of the numbers that actually foreshadow moves, sifted through the reader’s cognitive weather—volatility, liquidity, and the on-chain heartbeat.

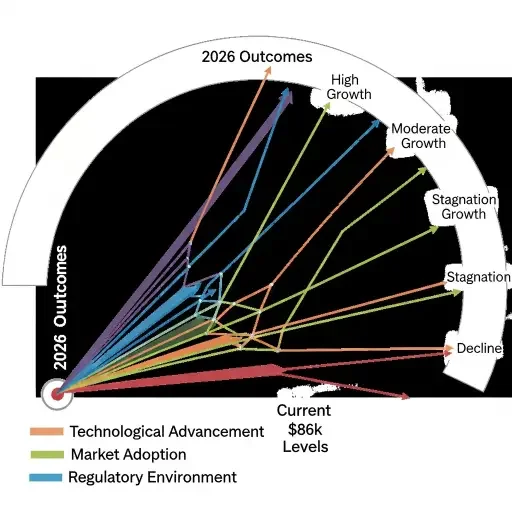
First, the frame: a bear market is not a single number but a pattern of stress tests. From current levels near $86k, the central question is probabilistic: will the price revisit $30,000 as a test of downside support in a prolonged correction, or find support and leap toward $50,000 as a confluence of improving fundamentals and risk appetite takes hold? And beyond those anchors, could a recovery arrive with velocity that makes the clock look slow—perhaps returning toward prior highs faster than historical bear-market recoveries would suggest?
The levers are real, and they operate at multiple layers.
Why a floor around $30k matters—and what would drive such a deep retracement
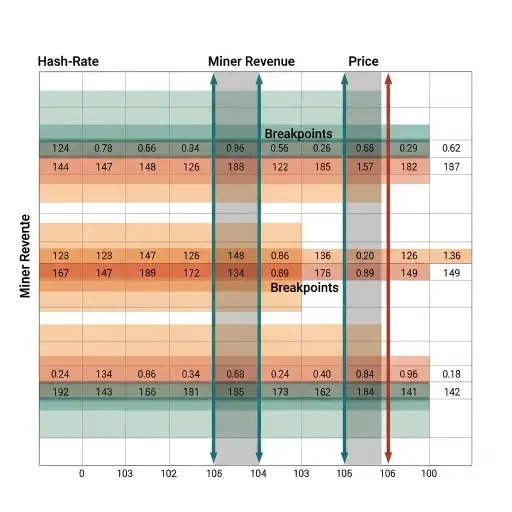
- Miner economics remain critical. Hash-rate has held relatively resilient despite the price drop from $126k to $86k, but if a deeper correction unfolds, mining revenue and energy expenses would compress margins further. When miners capitulate or consolidate under sustained price pressure below $60k-$50k, the network’s security dynamics shift and downside acceleration becomes more probable unless external liquidity floods in.
- On-chain profitability becomes increasingly bifurcated in deeper corrections: profitable long-term holder wallets may stabilize, while speculative wallets show pronounced risk-off behavior. In extended bear regimes, the network’s real transaction demand often fades, and price action can decouple from on-chain fundamentals for prolonged intervals.
- Macro liquidity, not sentiment alone, has the final say. The Fed’s recent halt to balance-sheet runoff provides a potential tailwind, but if broader risk-off conditions intensify—driven by recession fears, geopolitical shocks, or credit market stress—downside pressure could intensify even when on-chain activity holds some steadiness. A move to $30k would require sustained institutional risk-off behavior and retail capitulation.
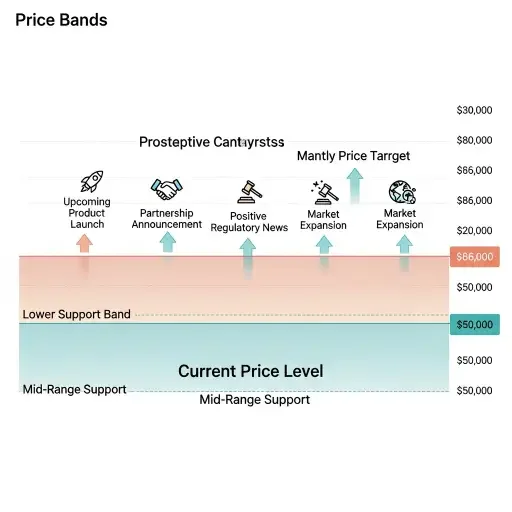
Could $50k be the new equilibrium—fast and structurally justifiable?
- Liquidity corridors may re-open selectively. The Fed’s pivot away from quantitative tightening, combined with potential rate adjustments in 2026, could reinject capital into risk assets. With a risk-on tilt, Bitcoin profits from correlation lifts with equities, particularly tech growth stocks that led both the rally to $126k and the recent correction.
- Demand-side signals show mixed but potentially constructive patterns. Exchange inflows after the November ETF outflows could signal accumulation at mid-range price zones; the meta-machine of options markets may add a skew toward delta that benefits a measured climb from current $86k levels toward $50k as a consolidation point before potential further upside.
- On-chain efficiency continues to improve. Layer-2 adoption and settlement efficiency (speed and cost reductions) could unlock previously dormant transactional demand, turning latent demand into realized price pressure. A stabilization around $50k would suggest healthy digestion of the rally to $126k before the next leg.
Faster-than-expected recovery: what would have to happen, and why it’s plausible—and perilous
- A catalytic liquidity shock—whether from renewed institutional allocation, major hedge fund rebalancing following the correction, or a macro shift toward higher risk tolerance as inflation concerns ease—could compress time constants. The current $40k drawdown from all-time highs might prove to be a healthy correction rather than the start of a multi-year bear market, especially if macro conditions improve in Q1-Q2 2026.
- Market structure incentives could align rapidly. Futures and options liquidity, convexity in the term structure, and a re-anchoring of risk premia following the November ETF outflows could accelerate price discovery. If the $86k level holds and institutional flows reverse, forcing a repricing that outruns macro news sequences becomes possible.
- The risk remains a false dawn. Rapid recoveries from current levels without durable fundamental support often retrace if the macro environment remains unsettled or if retail exuberance blinds risk controls. The entropy of a rally without structural reinforcement tends to burn fast, feeding a relapse. The recent drop from $126k to $86k serves as a reminder that momentum works both ways.

A layered way to read the numbers
- Layer 1 (Title): The core proposition—Bitcoin’s 2026 narrative hinges on whether price action from current $86k levels moves toward $30k in a deeper bear scenario, stabilizes around $50k, or accelerates beyond expectations back toward prior highs.
- Layer 2 (Abstract / Lede): This article maps the macro, on-chain, and structural signals that forecast or fail to forecast moves, emphasizing predictive edges rather than romantic narratives, in the context of a significant correction from October 2025’s all-time high.
- Layer 3 (Paragraphs): The micro-entropy design interleaves familiar anchors (Bitcoin’s volatility, mining economics, the recent $40k correction) with gradual novelty (new metrics, recovery pathways, Fed policy shifts) and a closing semantic checksum that anchors the reader to the central hinge point.
- Layer 4 (Sections and Transitions): The article moves from deep retracement dynamics to mid-range consolidation catalysts, then into risk and recovery velocity, all reinforced by explicit transitions and lexical echoing.
The neural scaffolding: what to watch in Q1–Q3 2026
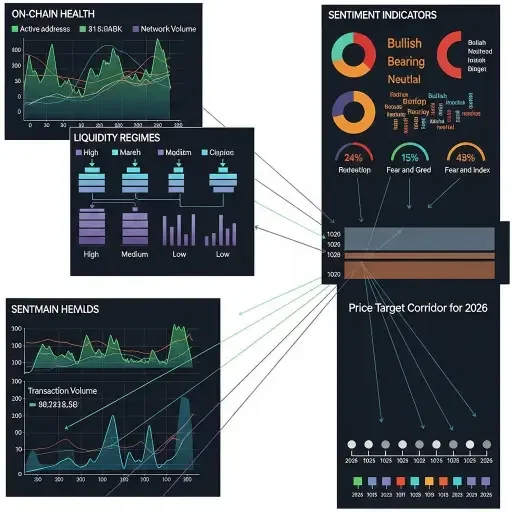
- On-chain health: hash rate stability given the correction, miner revenue trends, realized price, and active supply churn. These reveal whether the network is structurally robust or structurally vulnerable to protracted stagnation if price continues to fall from current $86k levels.
- Liquidity regimes: balance-sheet risk appetite post-Fed policy shift, velocity of capital following the November ETF outflows, and cross-asset correlations. If risk-on sentiment returns with improved macro clarity, Bitcoin tends to ride the wave; if risk-off deepens with recession or credit stress, further downside becomes probable.
- Sentiment signals: options skew following the correction, funding rates, and retail flow patterns after the pullback from $126k. They don’t predict with certainty, but they illuminate the probability mass of possible outcomes—whether current levels represent a buying opportunity or the early stages of a deeper bear market.
Endnote: the search for a principled forecast If we anchor in a robust, entropy-aware framework, the Numbers That Matter are not single-digit targets but the alignment of three axes: structural network resilience following the correction, macro-liquidity flows in the new Fed policy environment, and the efficiency of demand channels after record ETF outflows. A deeper test toward $30k, consolidation around $50k, or a velocity-driven recovery from current $86k levels all emerge from this triad. The art of reading the future isn’t fortune-telling; it’s setting the cognitive sensors to detect signal when it is strongest and to downshift when it is weak. In 2026, the most reliable forecast might be this: watch the rate of change in on-chain health as a leading indicator of price velocity from current levels, with liquidity dynamics and sentiment as speed limiters or accelerants. The correction from $126k to $86k provides a real-time stress test—how Bitcoin responds in Q1 2026 will determine which scenario unfolds.
Tags
Related Articles
Sources
On-chain data from Glassnode, Chainalysis; macro indicators from IMF and IMF-adjacent analyses; historical bear-market recoveries; prevailing market sentiment surveys; Bitcoin network metrics; liquidity indexes; November 2025 ETF flow data.